
Case study · 202306 / 06
Console
A real-time dashboard for system health and client behaviour, built from concept to launch by a team of three, with live WebSocket metrics and client scoring.
- Role
- Backend lead (team of three)
- Year
- 2023
- Stack
- Django
- Vue.js
- WebSockets
- AWS
Problem
I built Console at Aayulogic for RealHRSoft, its multi-tenant HR suite. Each client company runs on its own RealHRSoft instance, and the team needed one place to see how the system and every client were doing right now: whether the system was healthy and how each client was behaving.
With many separate instances, answering a simple question like “is anything wrong right now, and for whom?” meant checking each one in turn. Problems tended to surface when a client reported them, which is the worst possible time to find out. The goal was to flip that around: see trouble first, and know which clients need attention before they ask.
My role
I led the backend on a team of three and took Console from concept to production. I owned the system design, the live metrics over WebSockets, the client health scoring algorithm and the AWS deployment. I also ran code reviews and wrote unit tests and documentation alongside the features.
Leading a small team meant keeping scope tight. We agreed early on what Console had to answer on day one, built that end to end, and resisted turning it into a general analytics tool before the core was solid.
Architecture
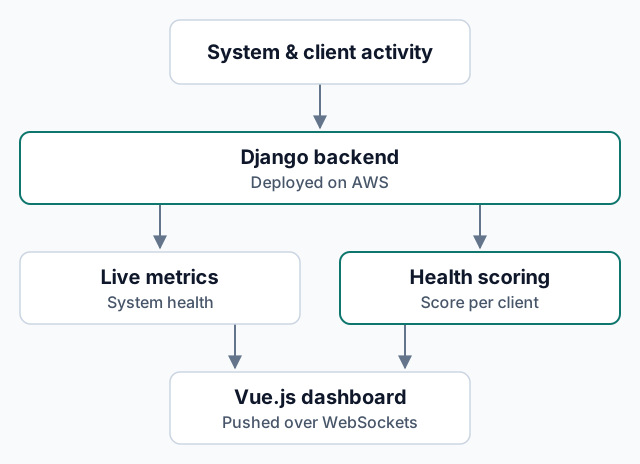
- Django backend collects system and client activity and computes metrics and scores.
- Live metrics on system health.
- Client health scoring turns each client’s behaviour into a single score.
- Vue.js dashboard receives updates over WebSockets.
- AWS hosts the deployment.
The split is simple on purpose. The backend does all the thinking: it gathers activity, works out metrics and scores, and decides what changed. The dashboard only displays what it is sent. That keeps the logic in one tested place and makes the frontend easy to change.
Key decisions & tradeoffs
Push, not poll. Metrics reach the dashboard over WebSockets, so it updates as things change instead of on a refresh interval. The cost is holding open connections on the server.
For a monitoring tool that cost is worth paying. A dashboard that is thirty seconds stale is a dashboard people stop trusting. To keep the connections cheap, the backend sends changes rather than full snapshots, and a client that reconnects gets the current state first so it never shows a half-updated view.
One score per client. A single health score is easier to act on than a wall of charts, but it hides detail, so it has to be explainable.
The score combines a few categories of signal: errors, response times, how actively a client is using the system, and whether their data is up to date. The important part was making every score traceable. When a client drops, you can open it and see which signals pulled it down, so the score starts a conversation instead of ending one. I checked it against clients the team already knew were healthy or struggling and adjusted until the score agreed with their judgement.
Tests and docs as part of the feature. With three people, nobody can be the only one who understands a piece. Code reviews, unit tests and documentation shipped with each feature, so anyone on the team could pick up any part of Console.
Outcome & metrics
Console went from concept to production with a team of three.
It gave the team a single live view across every RealHRSoft client instance: system health at a glance, a health score for each client, and the detail behind it one click away. Instead of waiting for a client to report a problem, the team could spot a struggling instance and act first.
What I’d do differently
Design the score with its users. I’d sit down with the people who use the dashboard before building the scoring algorithm, not after. Their sense of what “unhealthy” looks like is the real specification, and agreeing on it up front saves rounds of tuning.
Add alerts, not just a screen. A live dashboard only helps when someone is looking at it. I’d add alerts on sharp score drops early, so Console can tap someone on the shoulder instead of waiting to be checked.
Keep score history from day one. A score is far more useful as a trend than as a single number. Storing it over time from the start would show which clients are slowly declining, not only which are in trouble right now.